Also, learn how to debug Laravel artisan command here and debug Laravel unit test here.
Find yourself having too many times adding and removing Log::debug() or such value-output-based debugging method just to inspect variables or process flow? Switch to step-by-step code execution, breakpoint-based debugging using IDE (PHPStorm) and XDebug to save time and your sanity. This article will guide you through how to achieve that with the context of a Laravel web application in a Docker container and about debugging a Laravel web application running on a web server.
1. Install Xdebug plugin for PHP and config Xdebug to play well on Docker
Double-check if the PHP version installed in your Docker container already has Xdebug (by using command php -v and see if the output says anything about Xdebug). If you don’t already have Xdebug installed, you need to install it before continuing. Way to install xdebug varies as per environment and php distribution, however if your environment is using php 7.4 or newer, chance that pecl install xdebug should suffice.
After installing Xdebug, create a file named xdebug.ini under /<installed php folder>/conf.d/ (usually /usr/local/etc/php/conf.d/) and save these lines into it (note that you can use php --ini to know where your php configs are located at):
# For Xdebug version 2.x
zend_extension=xdebug.so
xdebug.remote_enable=1
xdebug.remote_autostart=1
xdebug.idekey=PHPSTORM
xdebug.remote_host=host.docker.internal
xdebug.remote_port=9001 # or any other arbitrary port
# For Xdebug version 3.x
[xdebug]
zend_extension=xdebug.so
xdebug.mode=develop,debug # develop mode in addition is also useful
xdebug.start_with_request=yes
xdebug.client_host=host.docker.internal
xdebug.client_port=9003
xdebug.idekey=PHPSTORM
xdebug.log=/tmp/xdebug.log # log is useful
# default port is 9003Next, docker-compose <your laravel service> restart (or if you don’t use docker-compose then it should be docker container <your laravel container> restart) to restart the container and make the changes take effect.
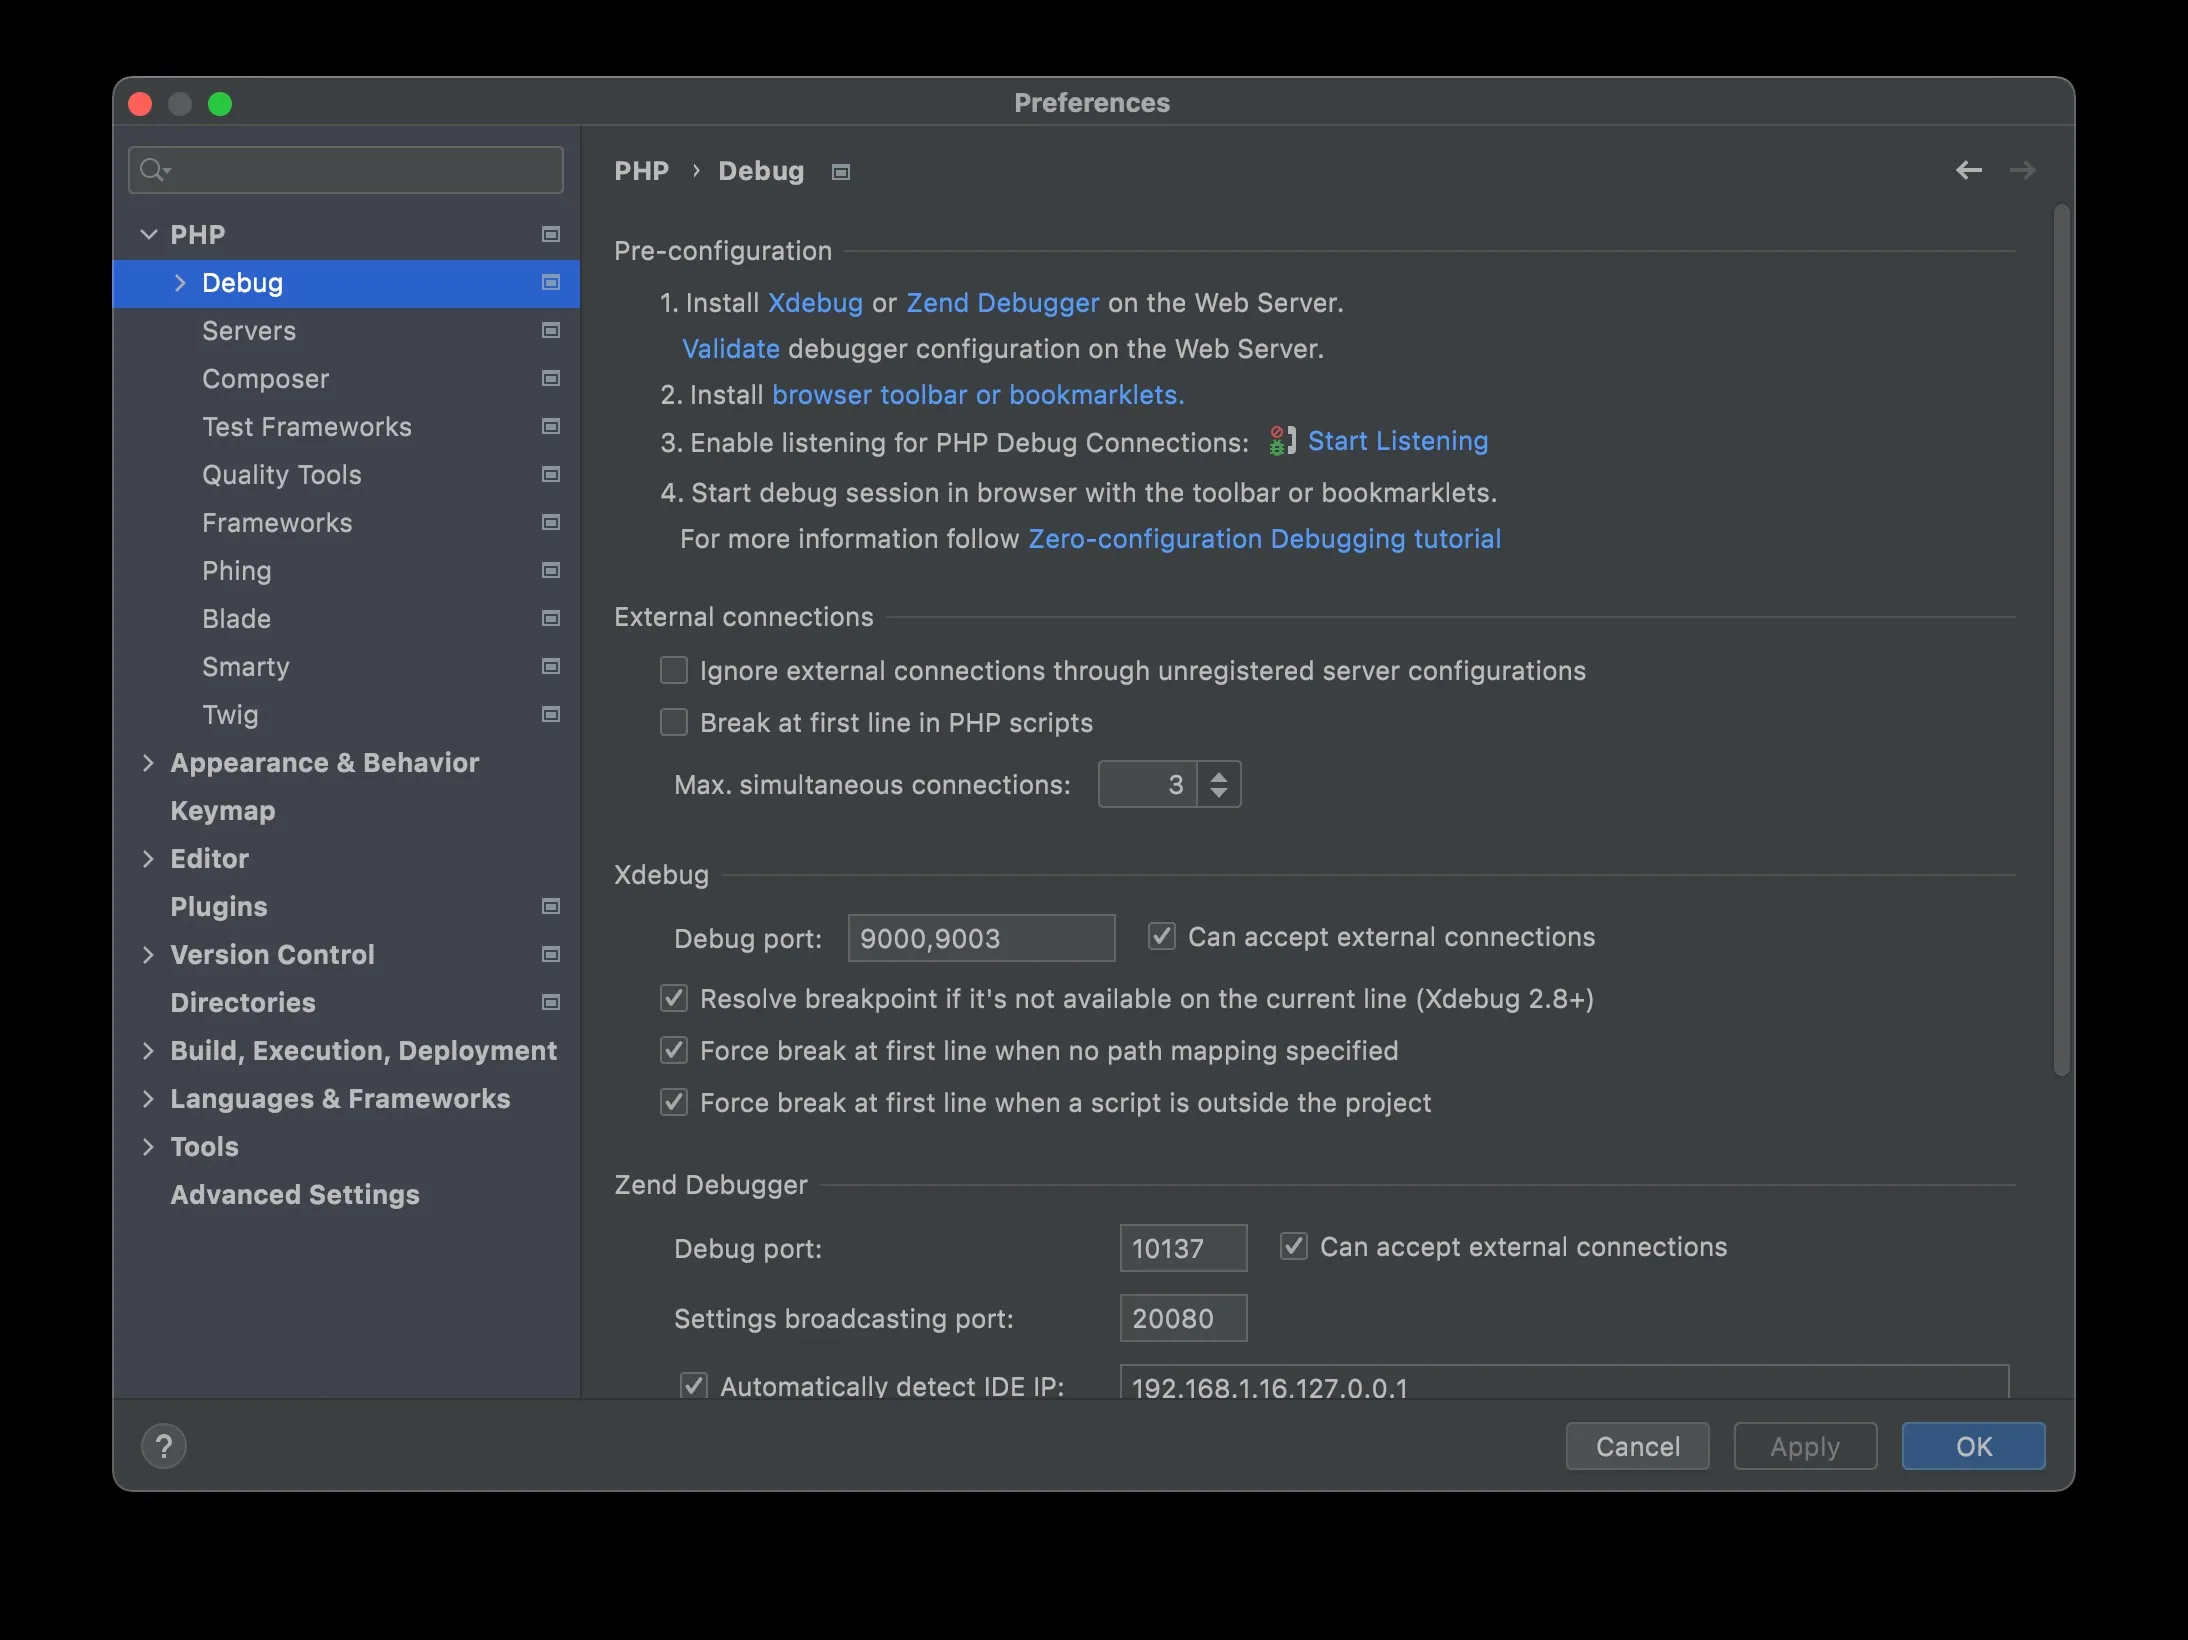
Finally, verify that the PHP > Debug section in your PHPStorm setting to make sure that the Xdebug port there points to the same port you defined in the xdebug.ini file.
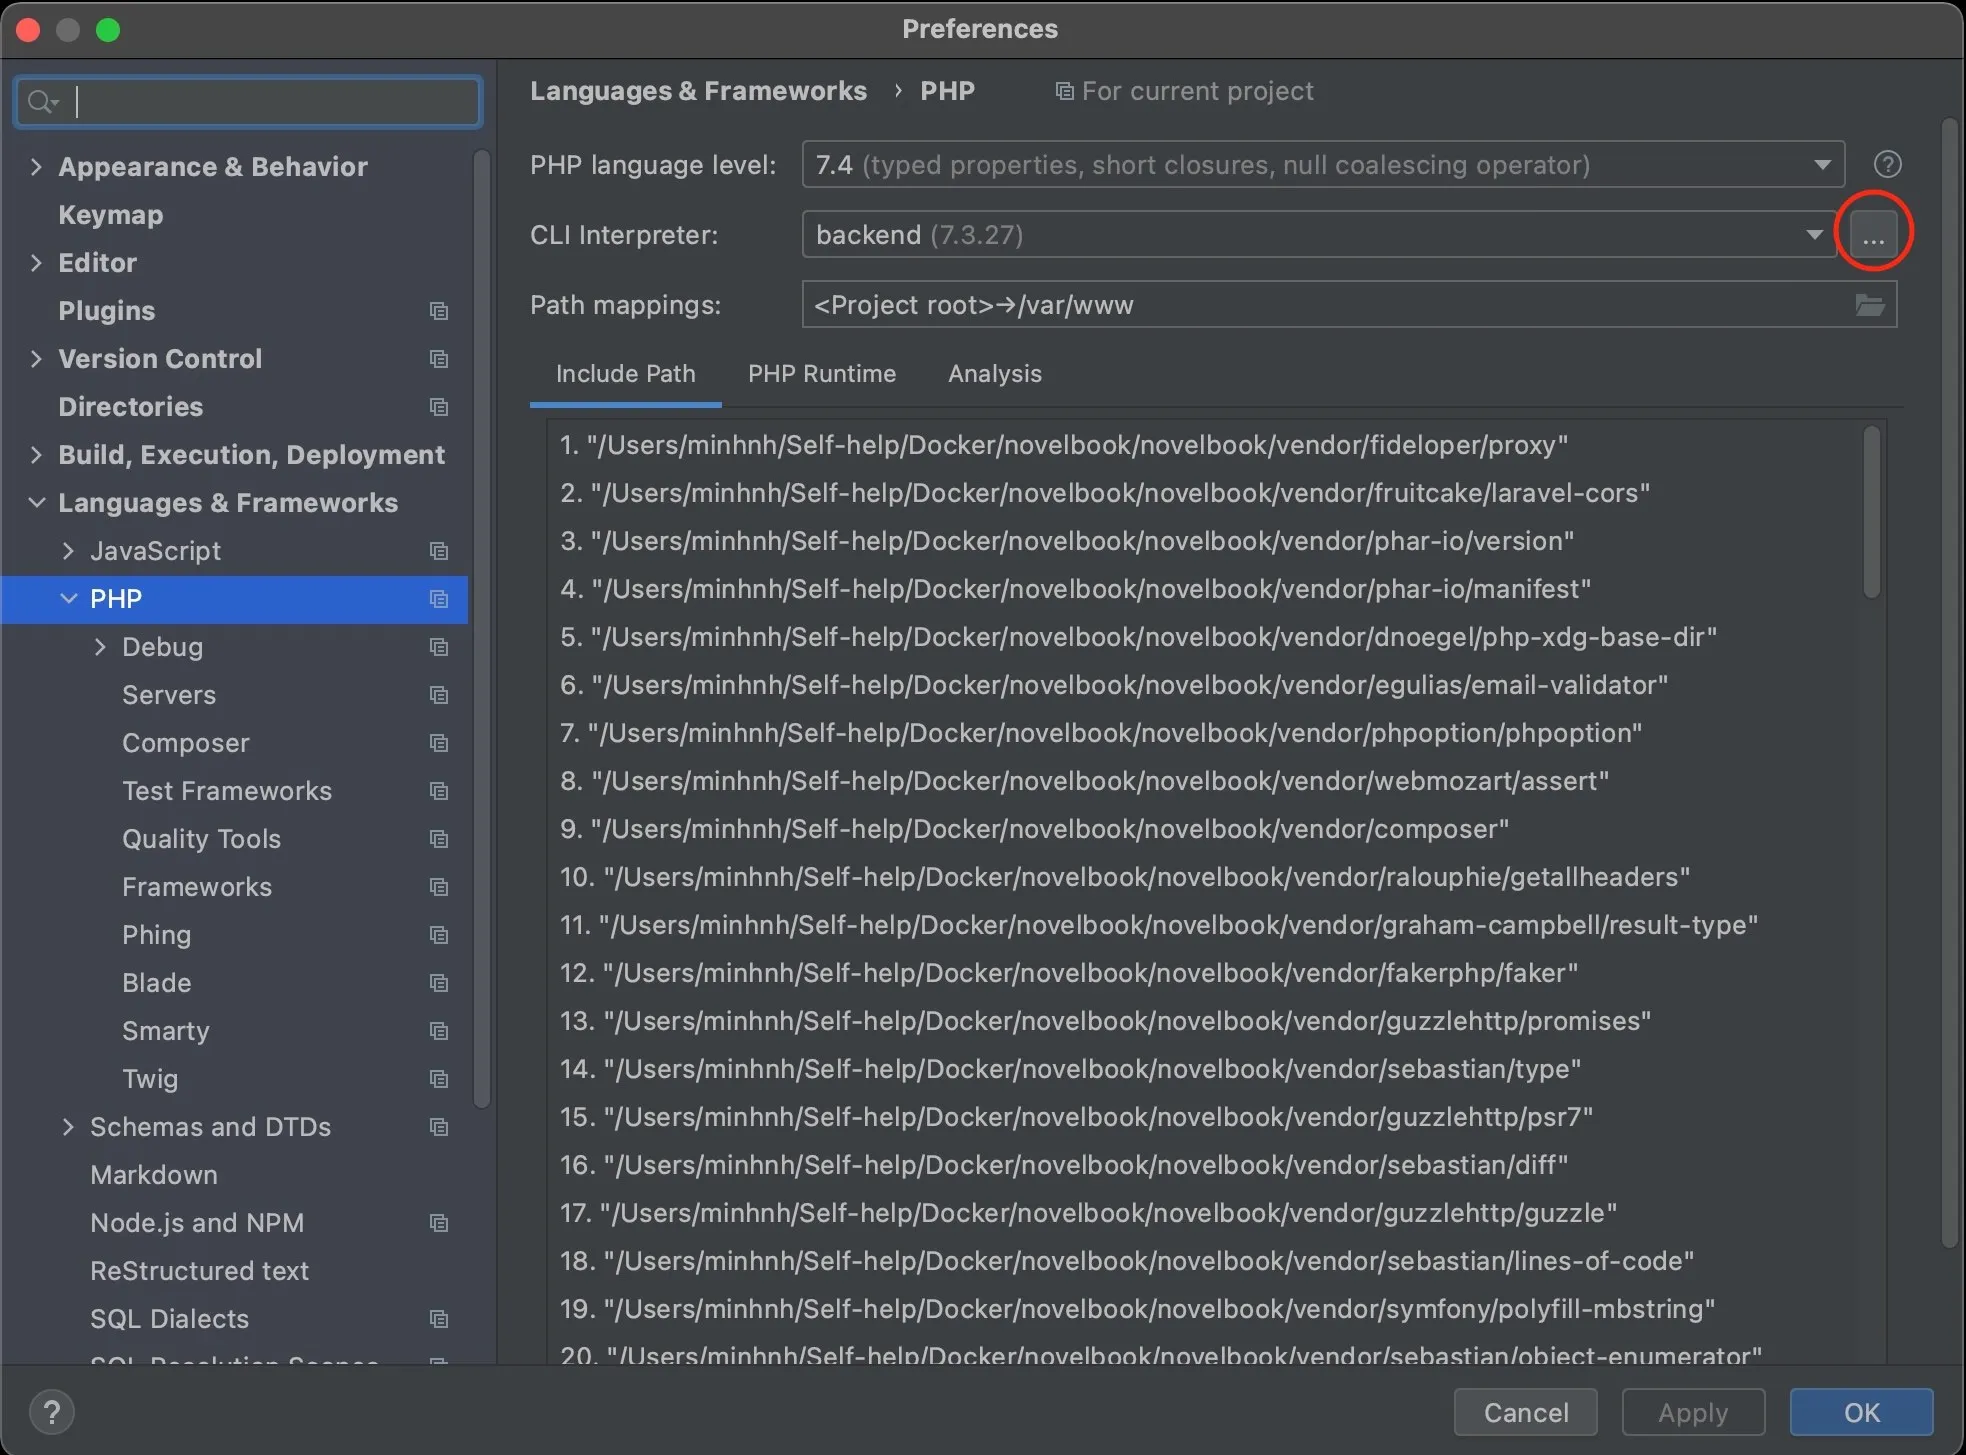
2. Config the PHPStorm CLI interpreter
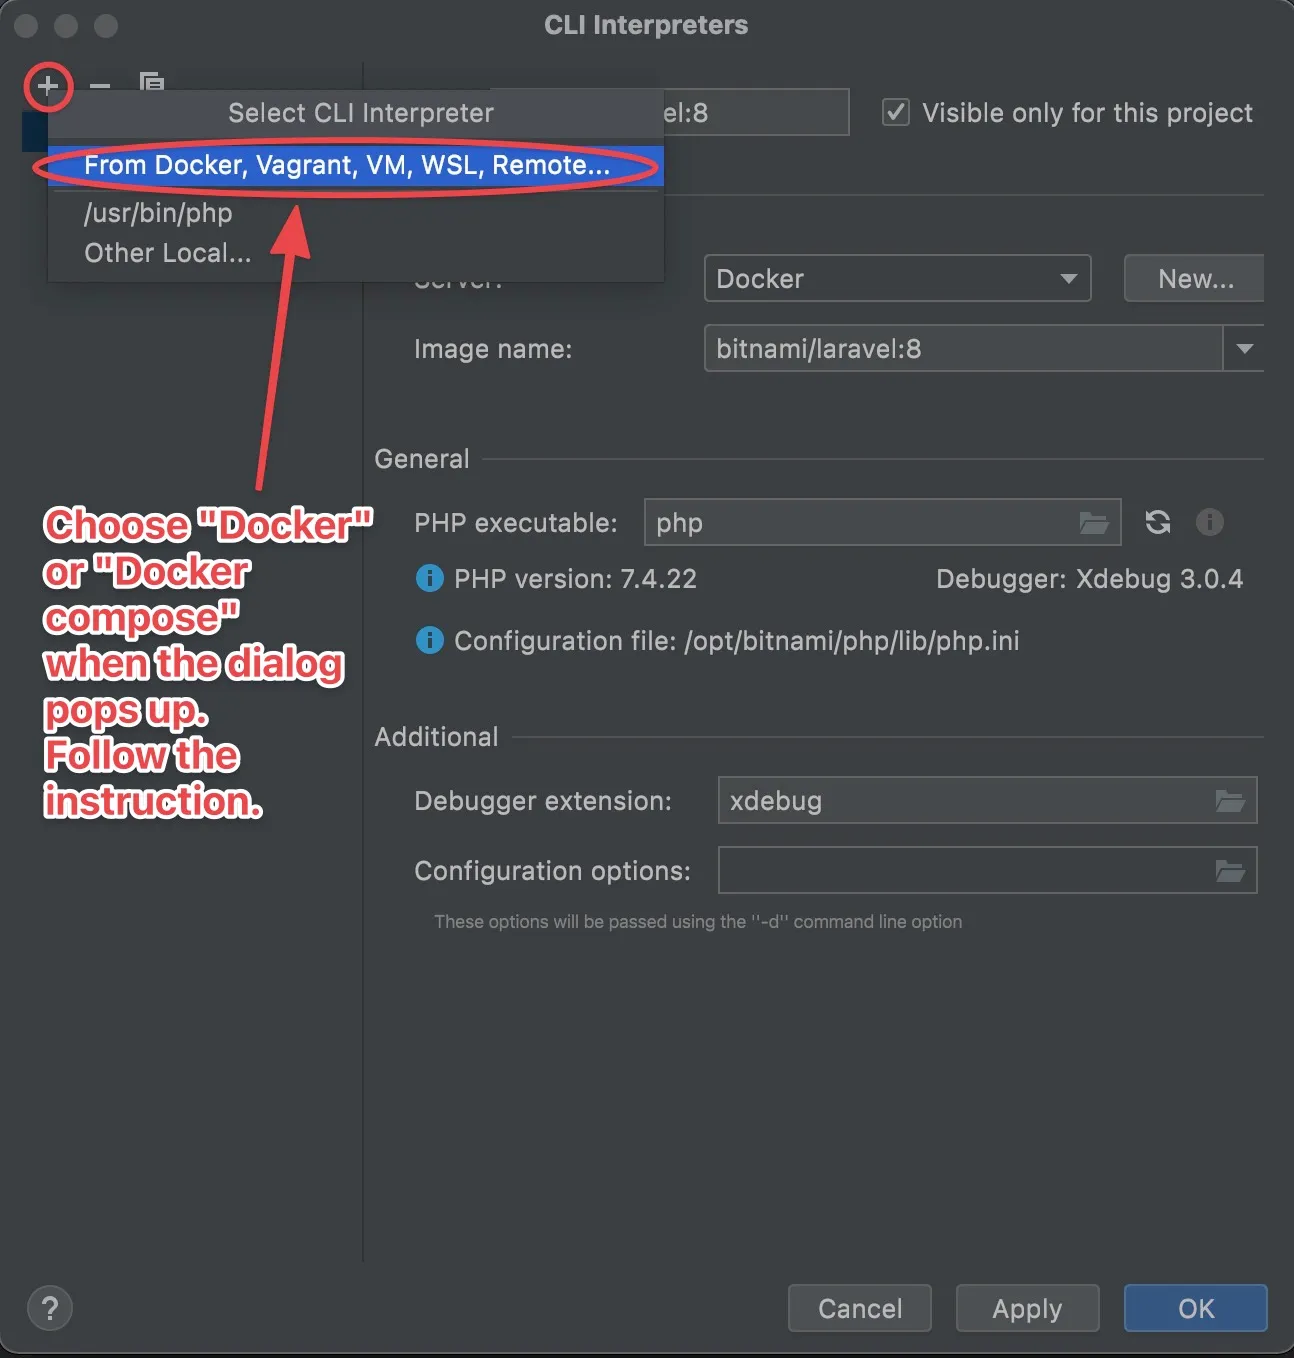
This should be very straightforward. In the PHP section in PHPStorm setting, create a new CLI interpreter config from your docker/docker-compose setting. PHPStorm will import the settings and magically getting CLI interpreter configs into place.
If you opt to configure a new CLI, verify that the IDE correctly detects the interpreter executable and debugger availability status after configuration.
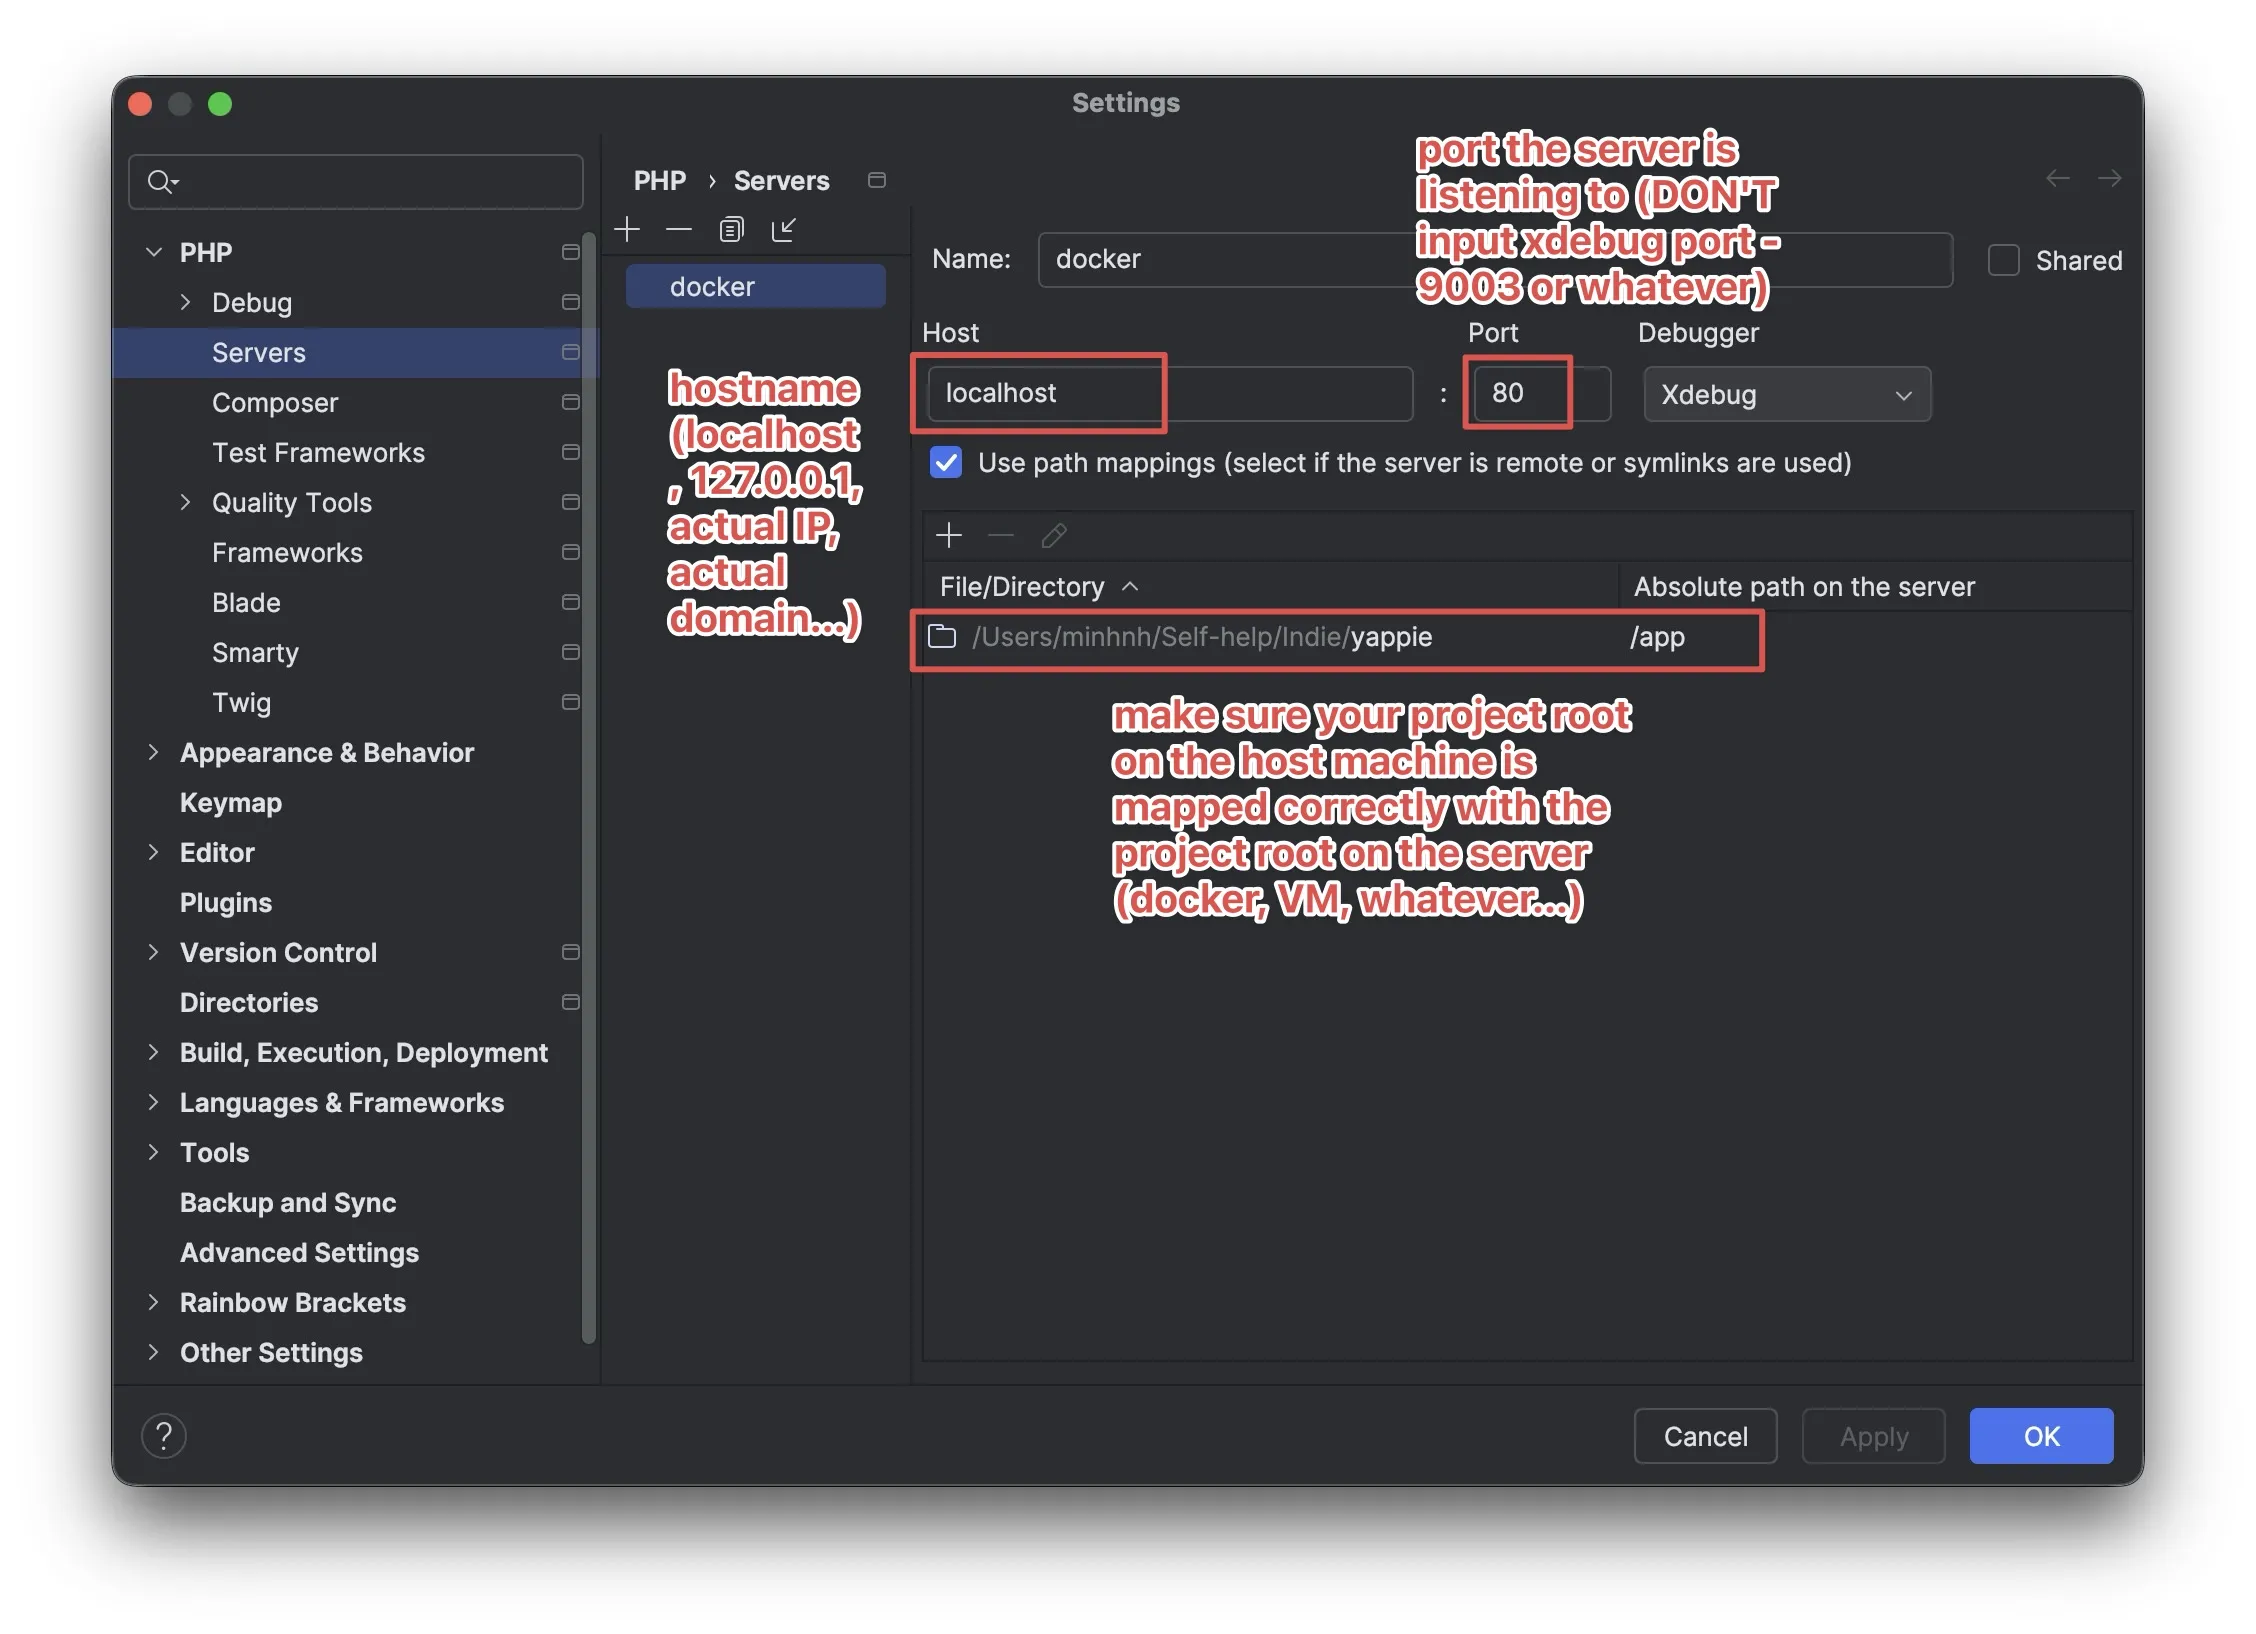
3. Config the Server setting in PHPStorm
Go to PHPStorm preferences > Languages & Frameworks > PHP > Servers, here you can configure PHPStorm server settings for the debugging. I noted all the components that required for the server settings in the image below.
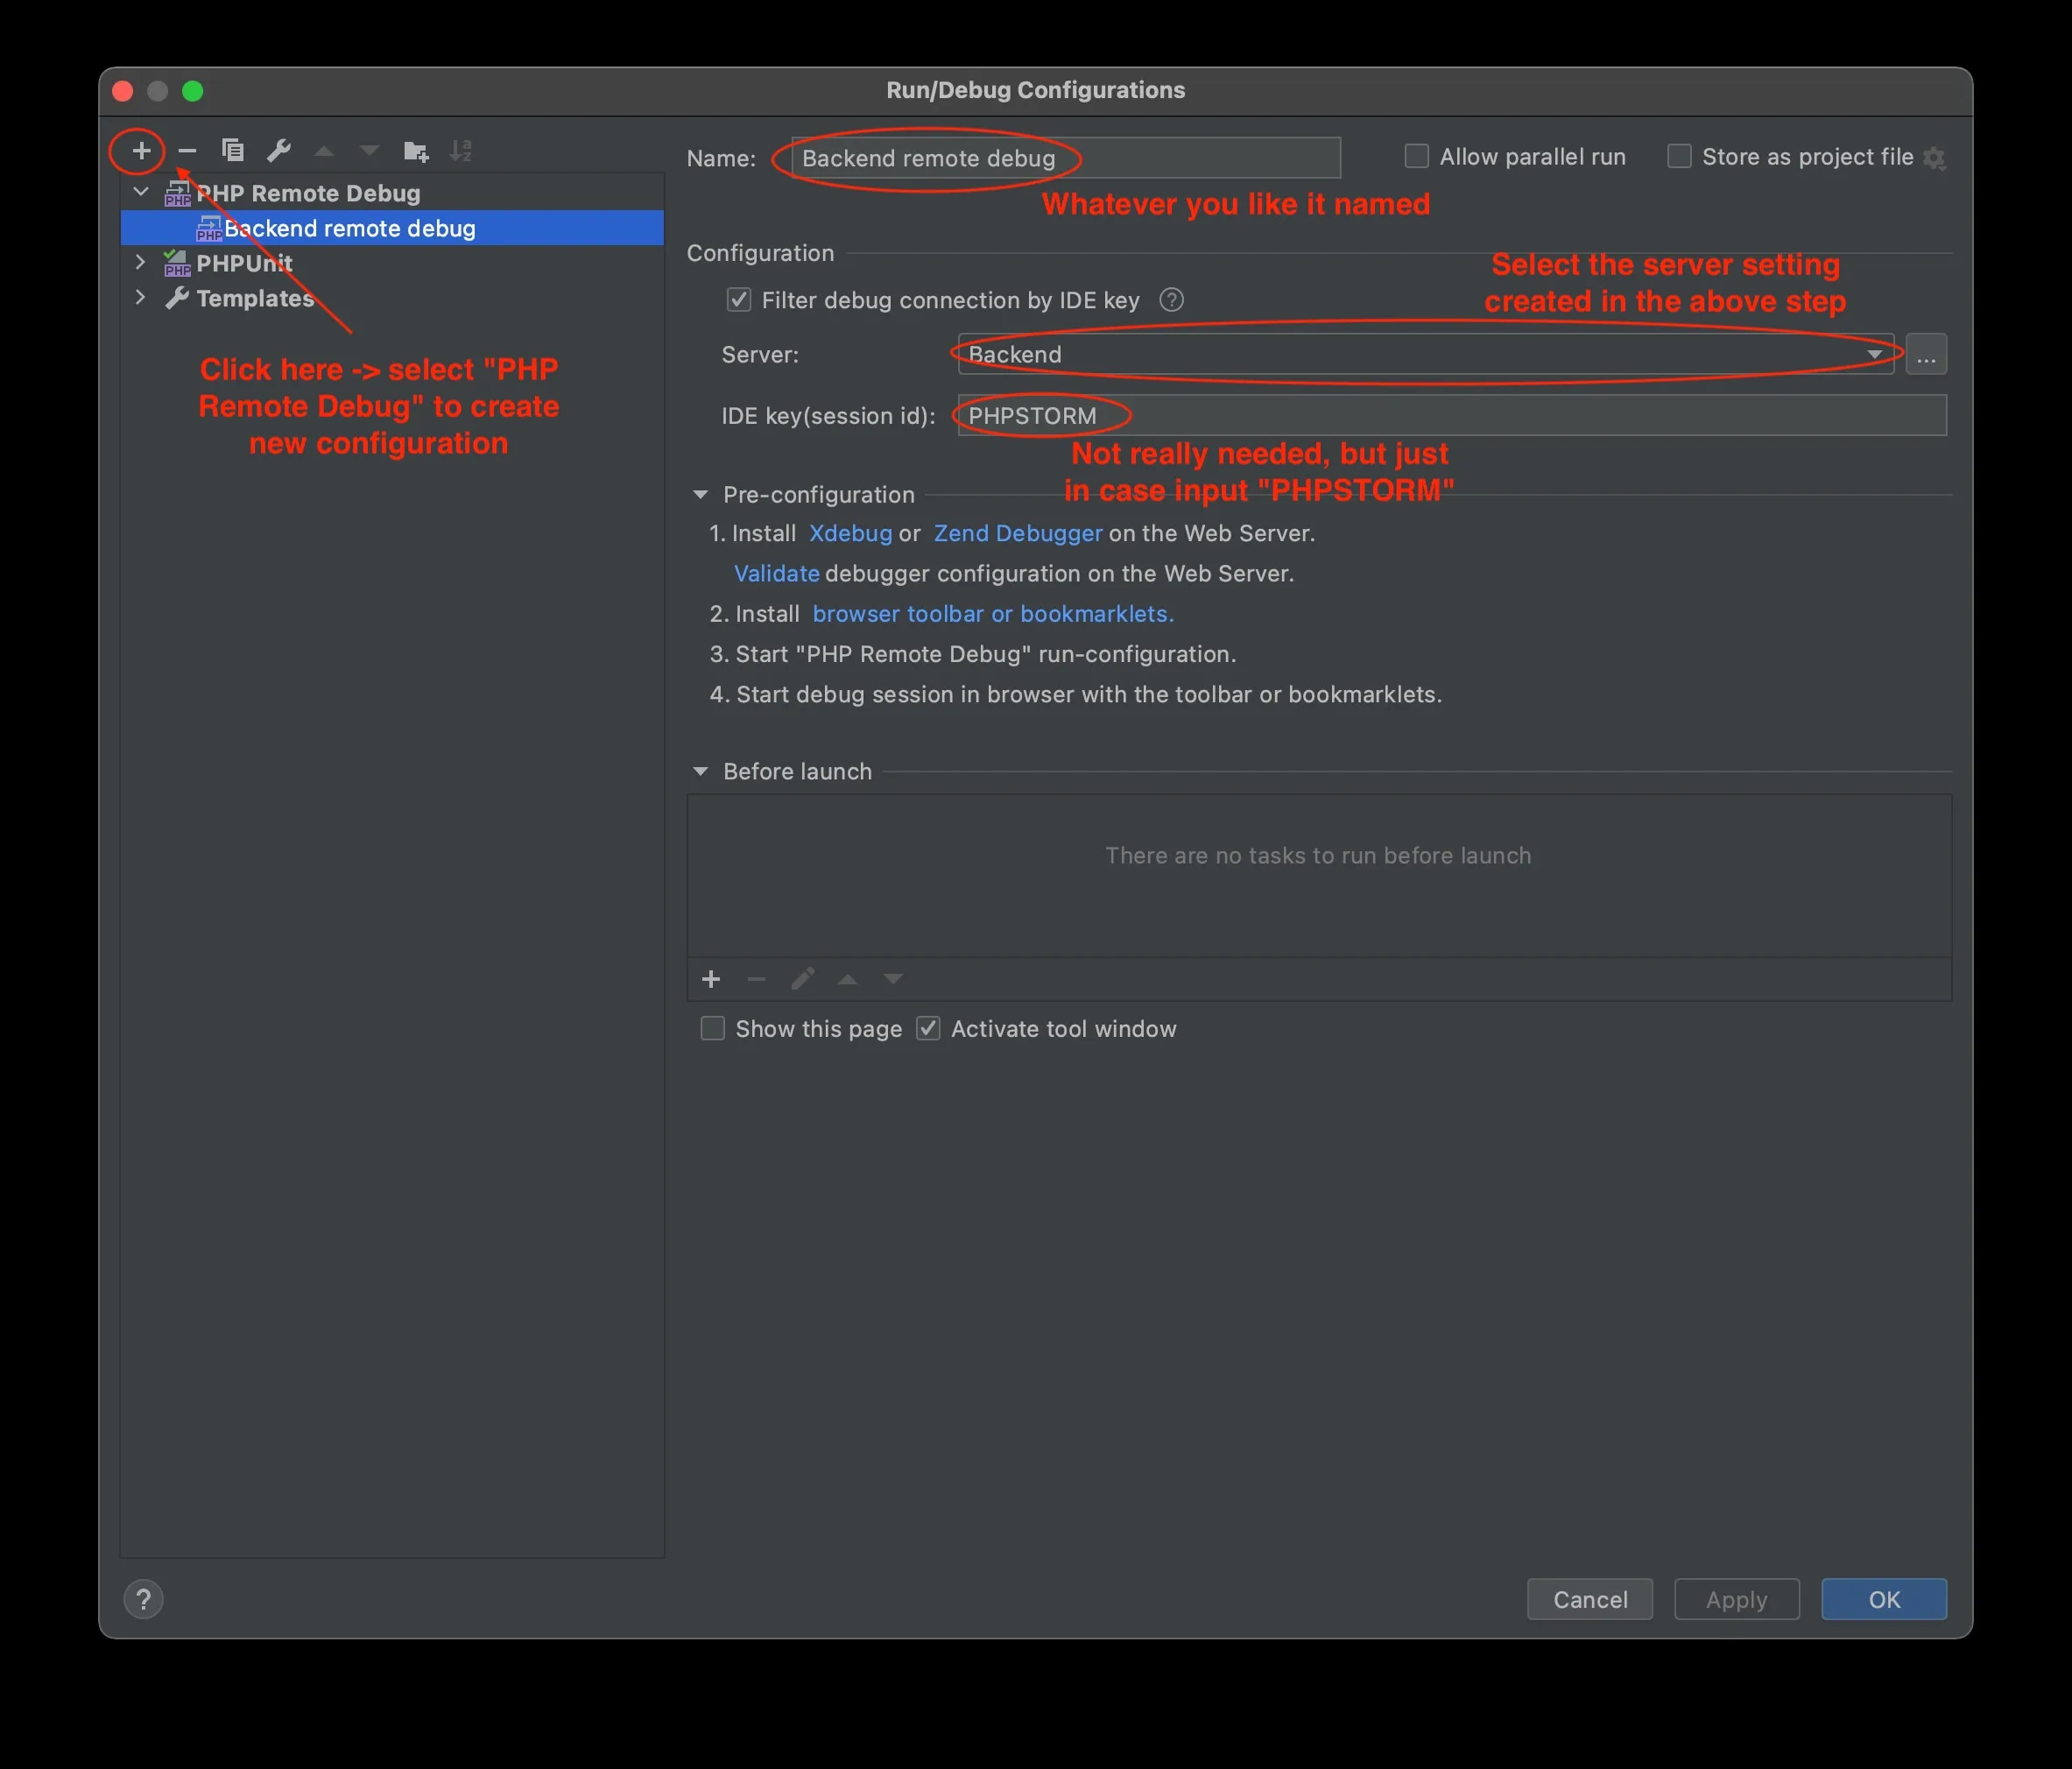
4. Setup debug configuration
The last step to get your interactive debugger working is to open Run/Debug Configuration and create a new “PHP Remote Debug” configuration. Refer to the image below.
After finishing all the settings, apply and OK, and we’re good to go!
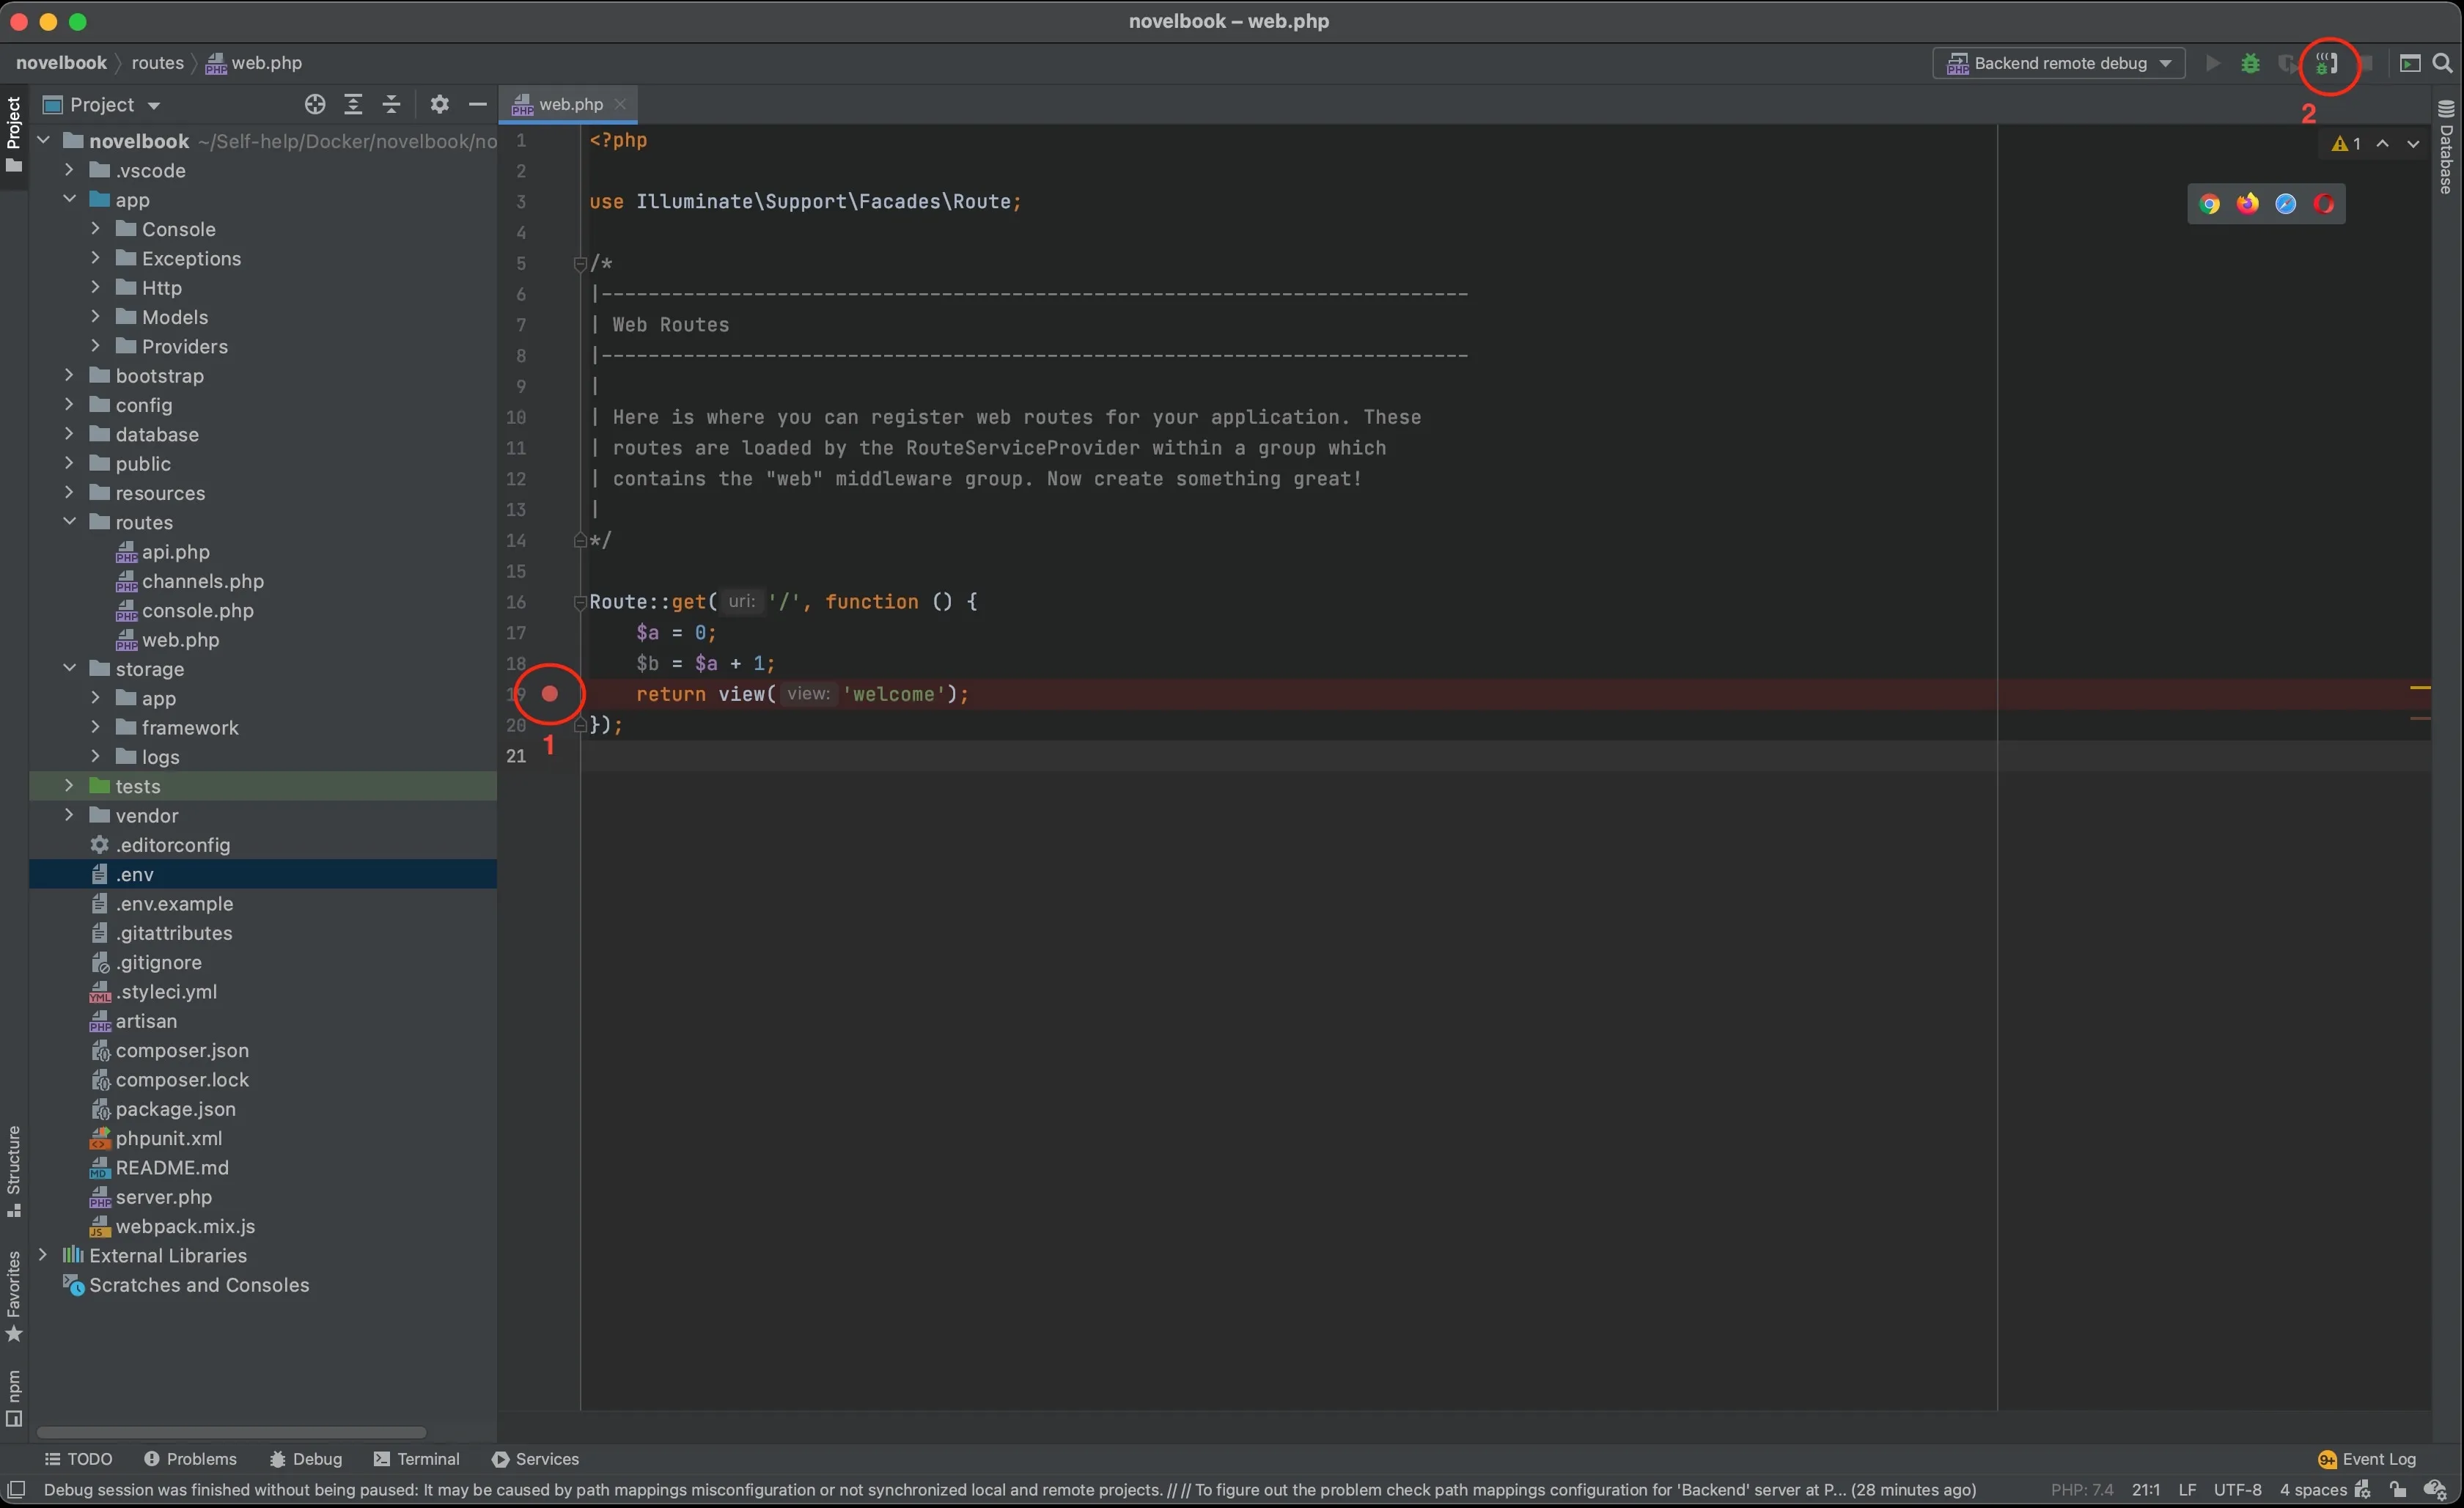
5. Set breakpoint, and start debugging process
Refer to the image below. I added a few lines to the web.php file in the brand new created Laravel project. After putting a breakpoint (as circle 1 in the image), pressing “Start listening for PHP Debug connection” icon (as circle 2) to listen to the incoming requests from XDebug.
Alternatively, you can try pressing the “Debug” button as well if the listening for debug connection button doesn’t work.
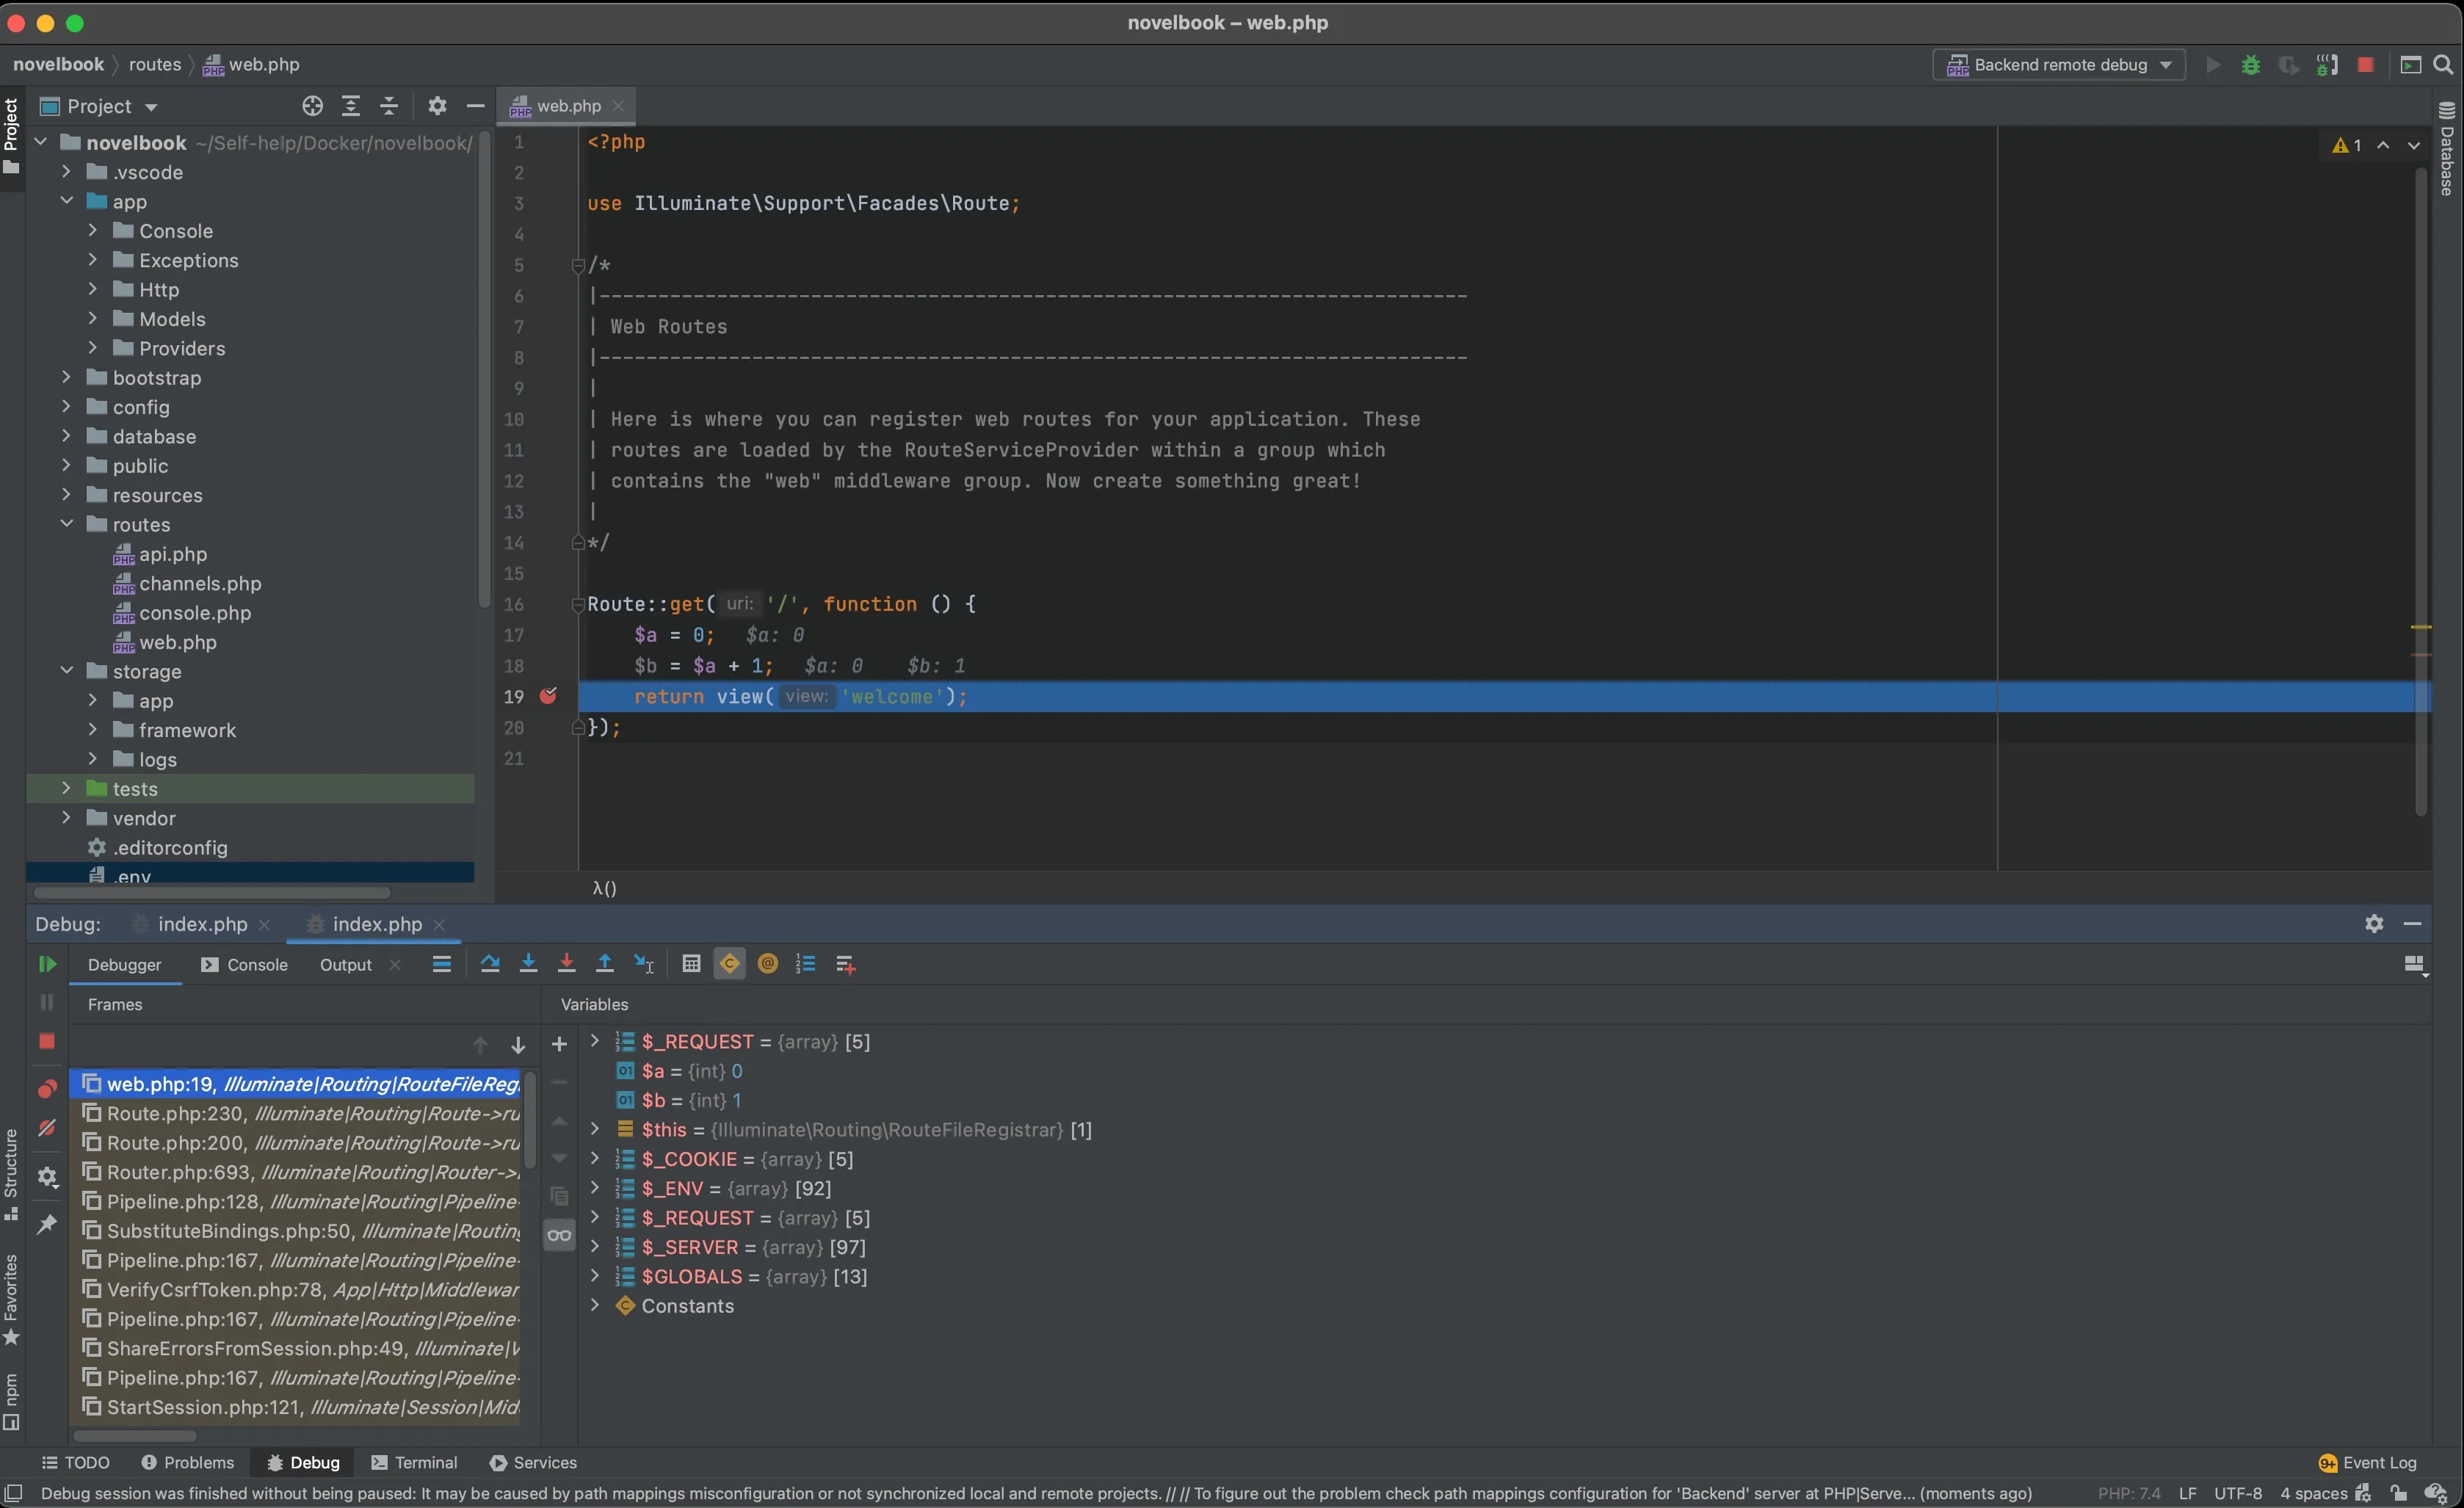
Try accessing your Laravel web application from the address defined by your Docker setting (usually it is localhost:<port exposed by Docker set in docker-compose.yml or Dockerfile>). The debugger should stop at the breakpoint, conveniently displays all variables’ values up to this step. From here, you can execute code step-by-step, continue executing the program until the next breakpoint or stop executing altogether. Much more elegant and time-saving than output-based debug, no?
I hope this can help your Laravel web application debugging session in Docker and PHPStorm become easier and more enjoyable.
You can also learn how to debug Laravel artisan command here and debug Laravel unit test here.