Debug NestJS application in Docker with Jetbrains WebStorm IDE
Got a NestJS project running inside a Docker container and looking for how to remote debugging on Jetbrains IDE? Look no further! I'd painstakingly searched, gathered and simplified what have worked for me so that you don't have to :)
Table of contents
Without further ado, here we go!
Docker setup
Here is a typical Dockerfile for spinning up a NestJS container up and running. Your own NestJS Dockerfile might look a bit more complicated than this, but I believe they are very similar structurally.
# Assuming the Dockerfile lies in your NestJS project root folder

FROM node:20

WORKDIR /app

COPY package*.json ./

RUN npm install

COPY . .

RUN npm run build

CMD ["npm", "run", "start:prod"]
And here is a typical docker-compose.yml file to incorporate that NestJS container into a bigger setup on your local:
version: "3.7"
services:
  # Your NestJS container
  backend:
    build:
      context: ./test-nestjs  # where the Dockerfile above lies
    command: npm run start:debug
    ports:
      - "3000:3000"	# default NestJS serving port
      - "9229:9229"	# remember to open this port for the debugger
    volumes:
      - ./test-nestjs:/app

  # your front end, DB, cache... services
In this docker-compose.yml I’m overriding the default bootstrap command in the above Dockerfile by running the container in debug mode.
One caveat, the initial start:debug script that comes with a fresh NestJS install won’t be enough if we want to do remote debugging here. The NestJS container’s Node debugging server would be automatically bound to only its localhost where our IDE debugging client can’t reach.
We need to bind the debugging server to every available network interface in the container so that our IDE debugging client could reach, so let’s modify your package.json like this:
...
"scripts": {
    ...
    "start:debug": "nest start --debug 0.0.0.0:9229 --watch",
    ...
  },
...
Binding to 0.0.0.0 technique can be used with other NodeJS based framework as well, not just NestJS.
IDE setup
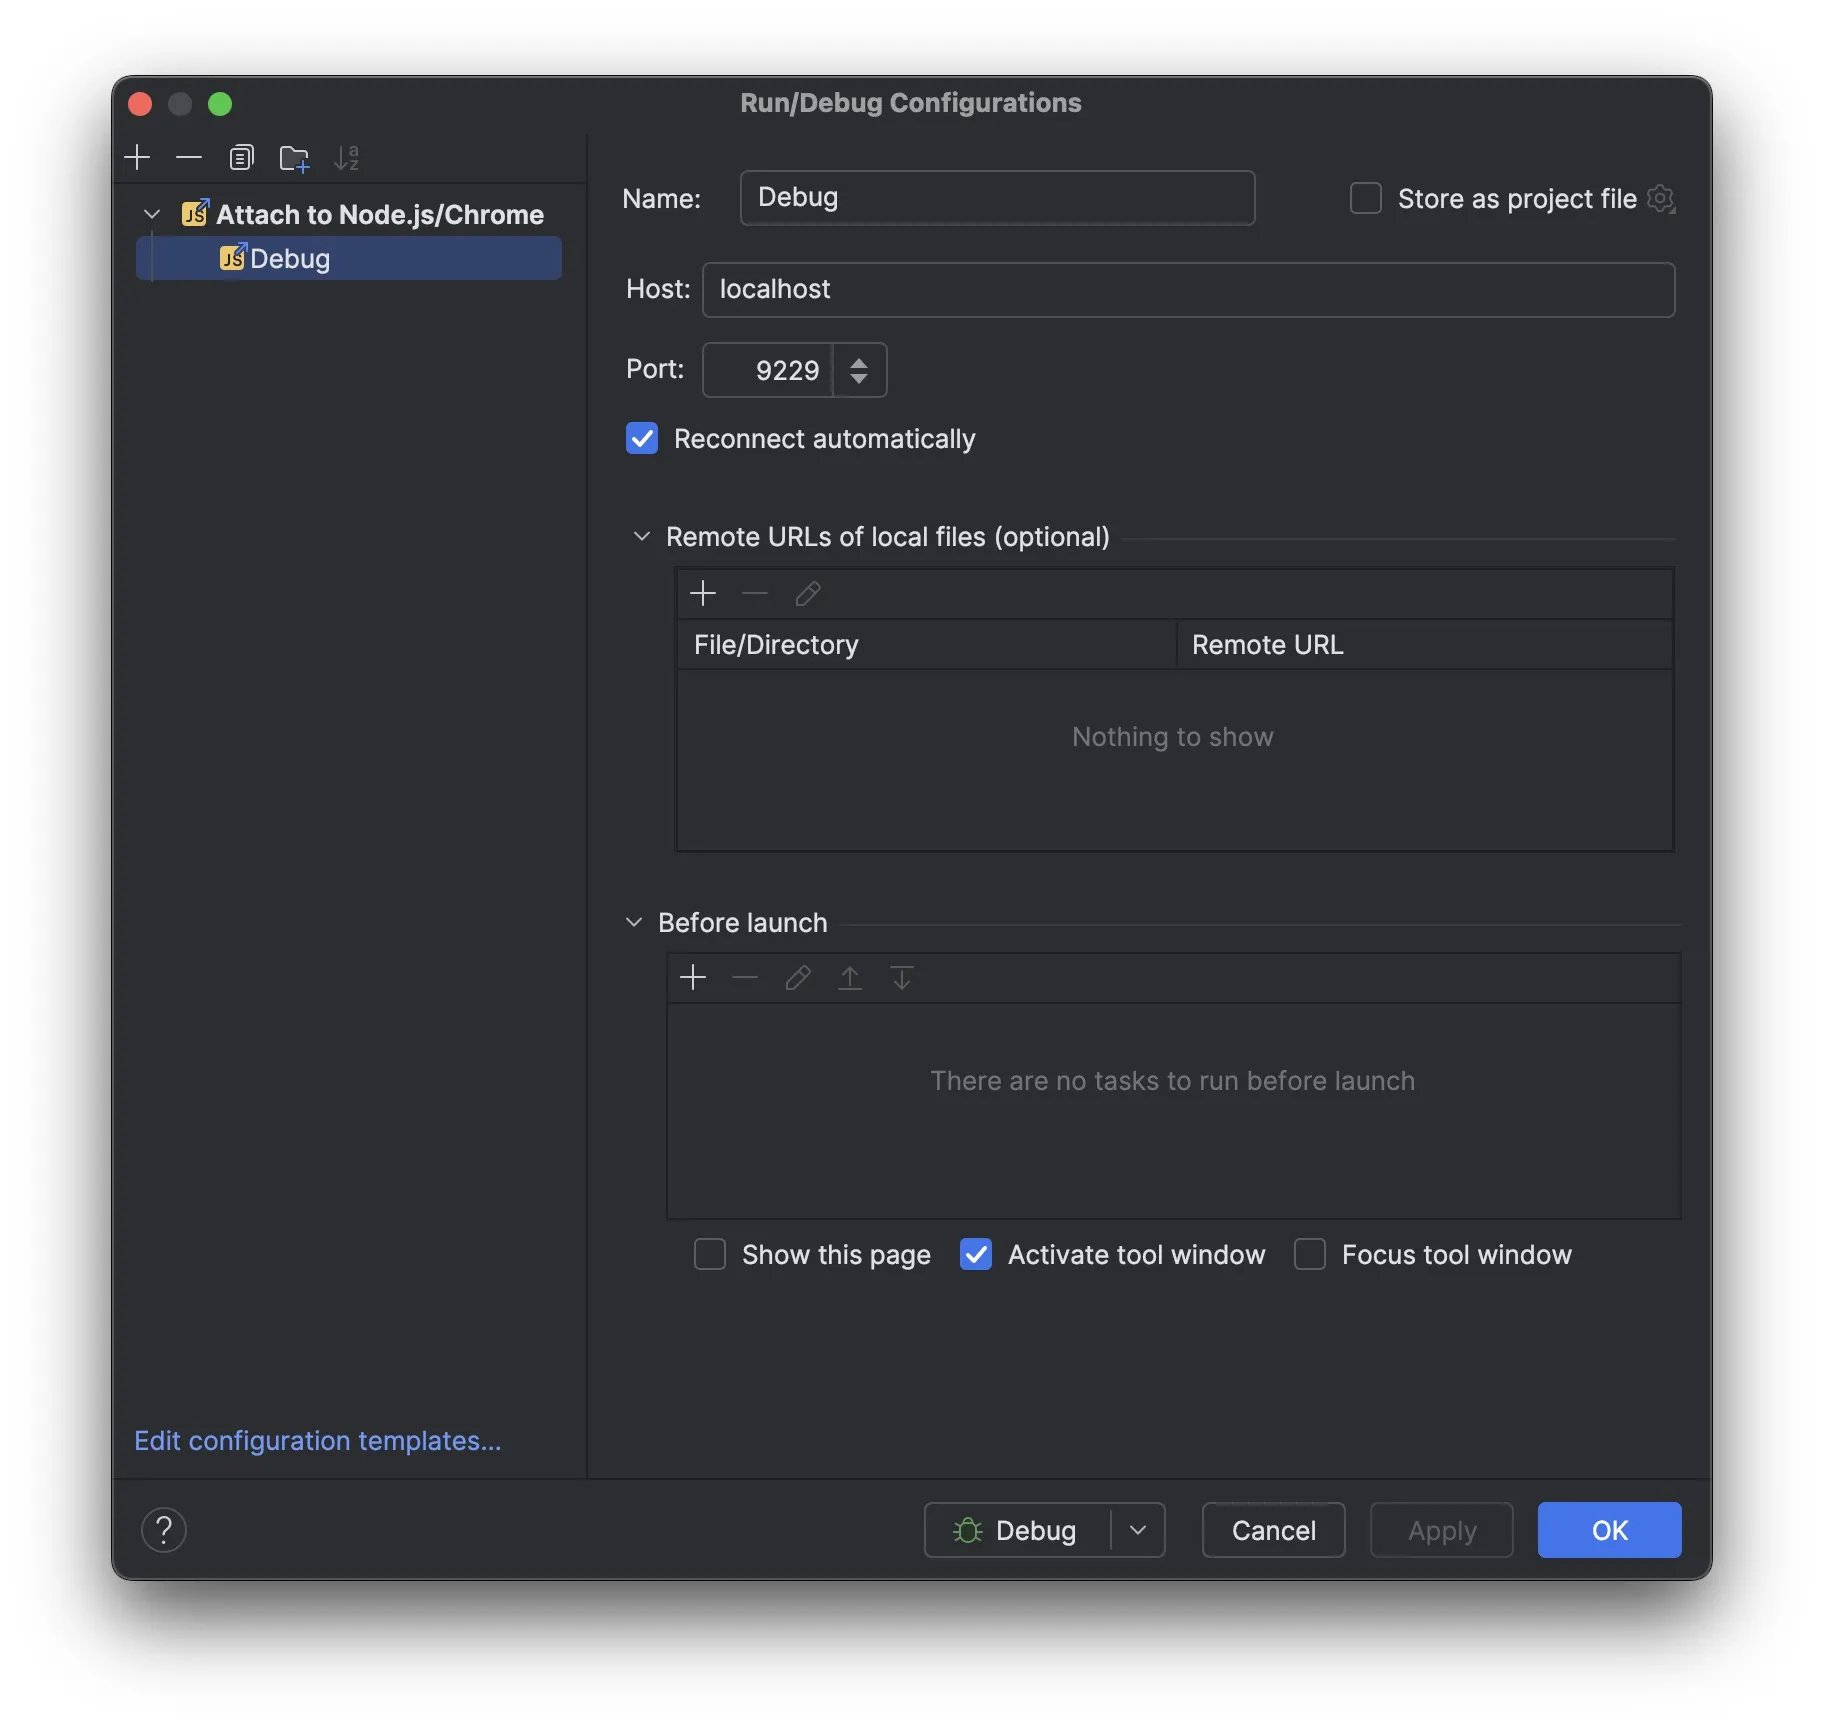
Create a Run/Debug config entry like this in your IDE:
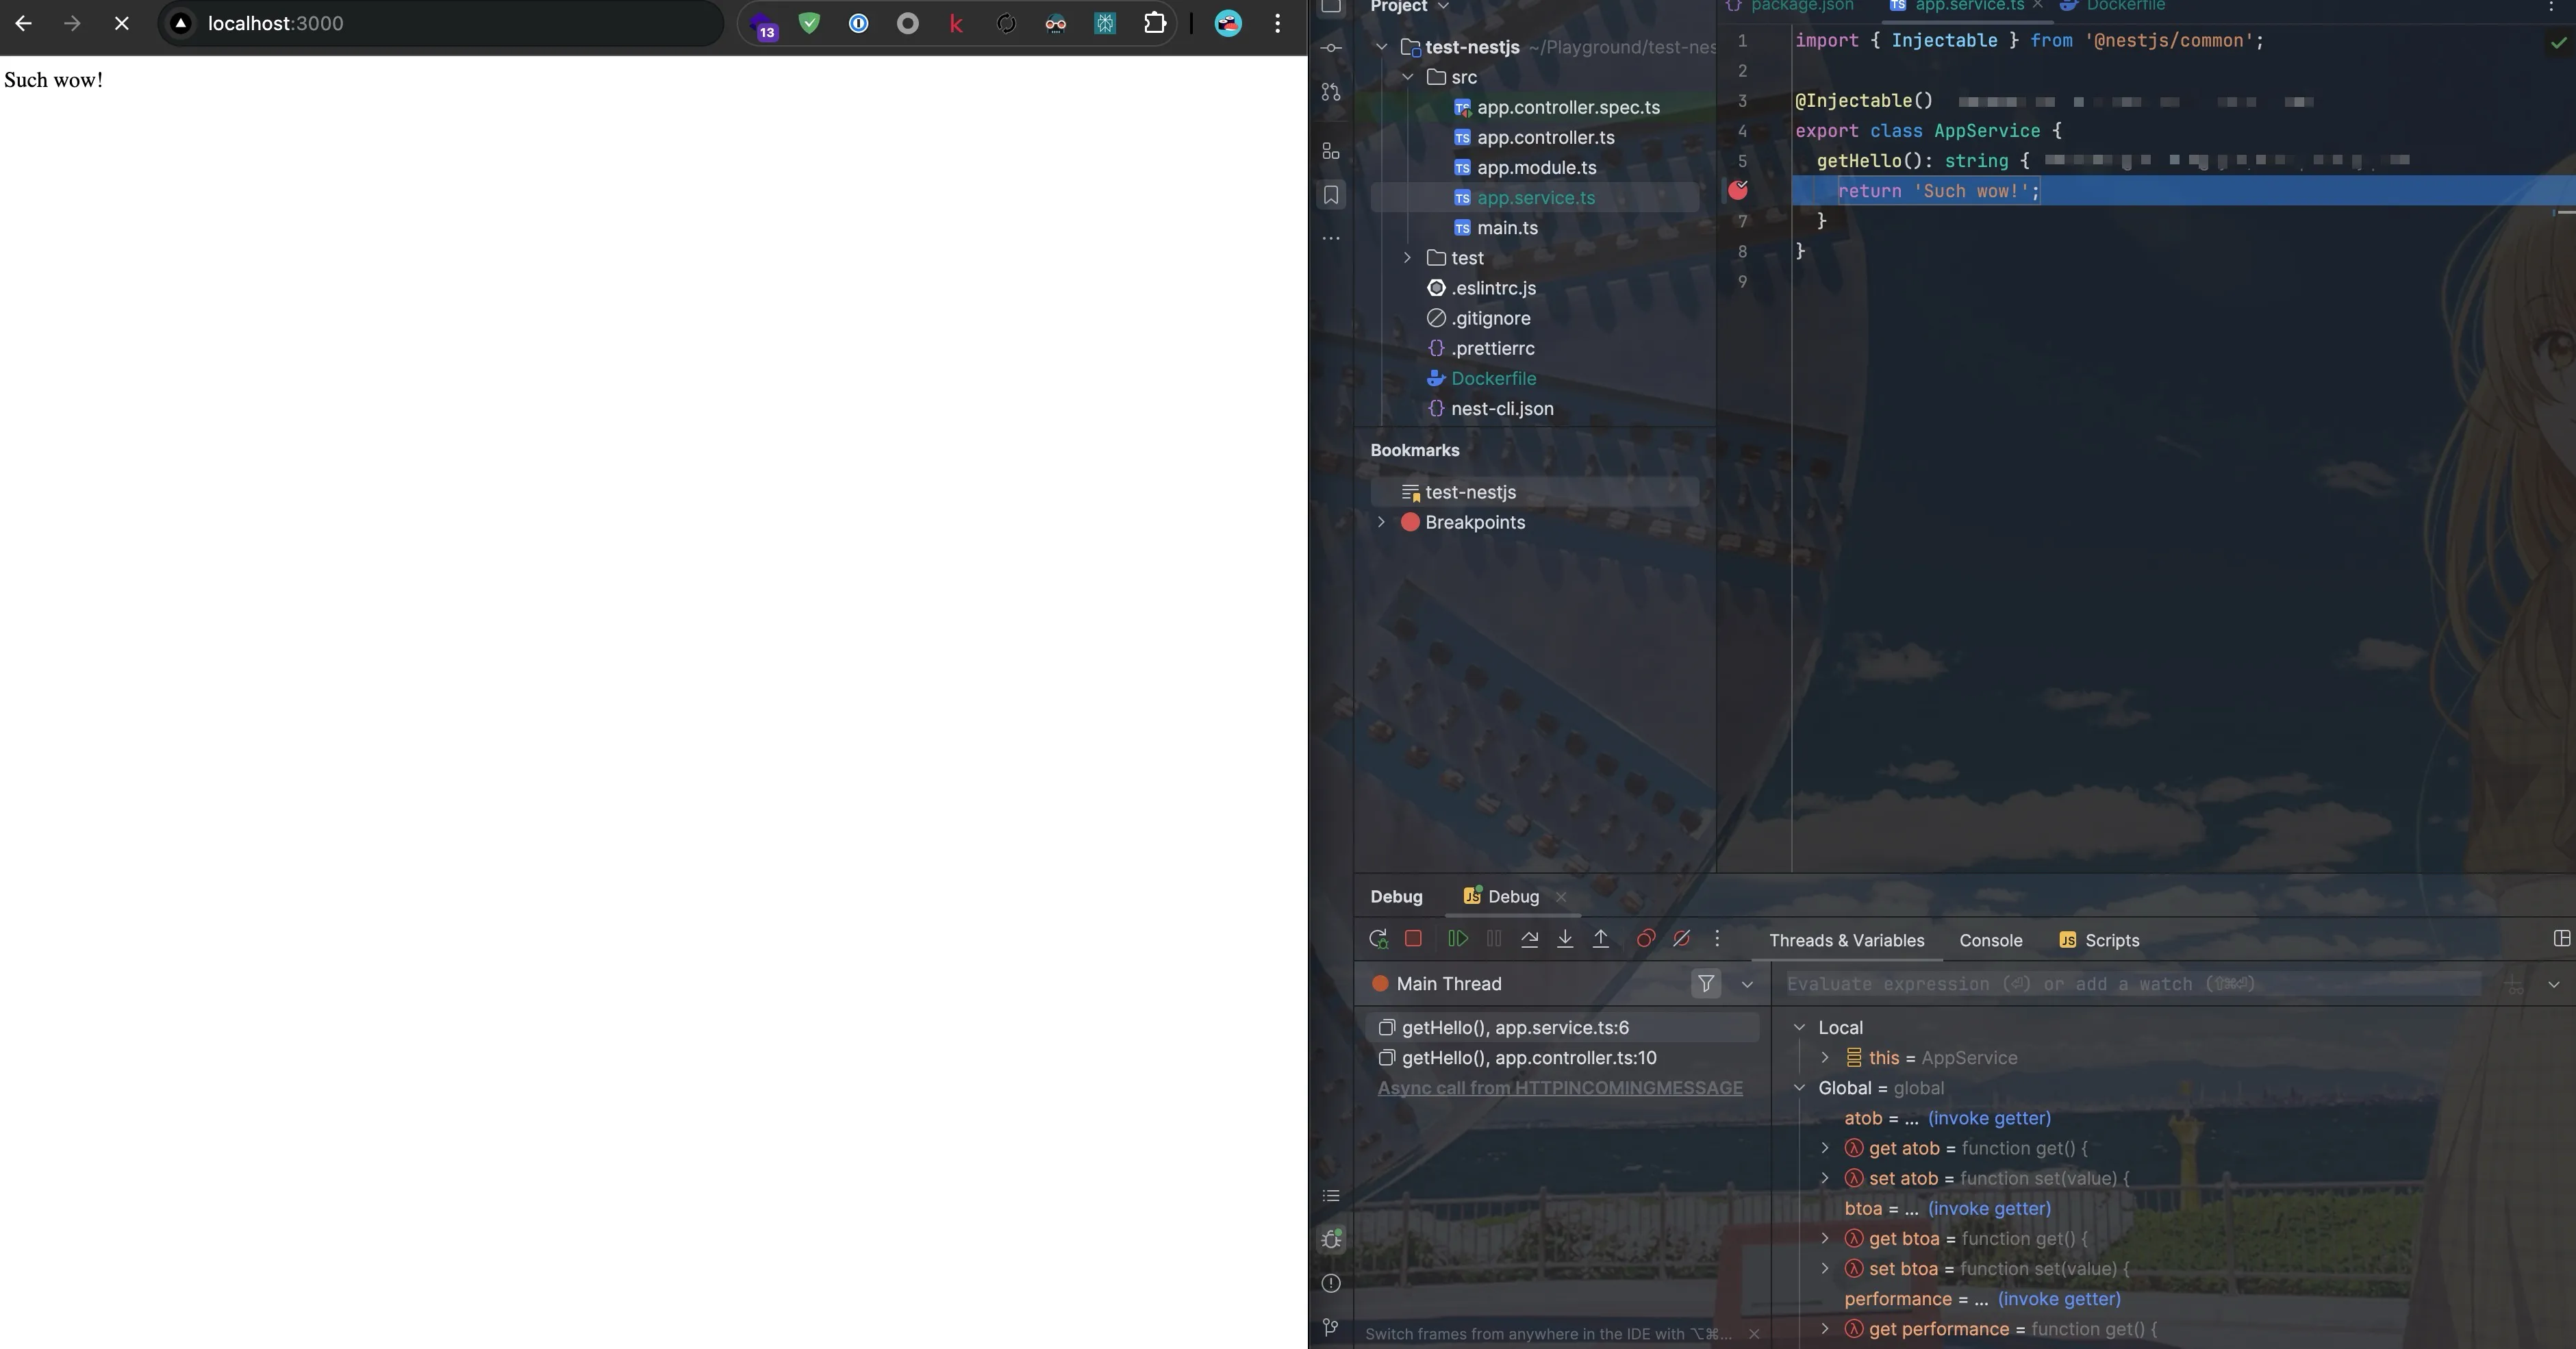
Aaannd that’s it! Now if you put a breakpoint somewhere in your code, hit Debug on the config you just created and try accessing the endpoint containing the breakpoint on your browser, IDE should stop the execution at that breakpoint for you to inspect ;)
Boi, I really wish setting up remote debugging for PHP and Jetbrains IDE could be this simple…